
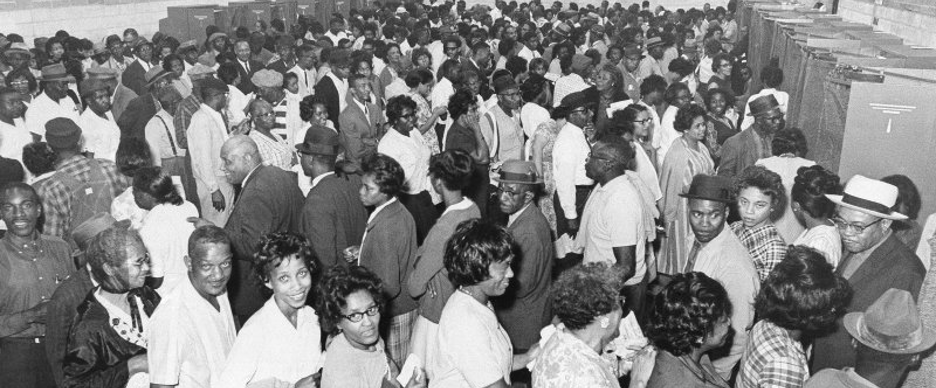
Here’s a timeline of American events that have had a significant impact on the reason why I choose to exercise my constitutional right to vote:
1619 – 1865: Legal Slavery in the United States of America
1869: Ratification of 15th Amendment allowing for African American Men to Vote;
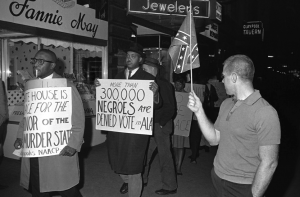
1882 – 1968: 4,743 lynchings of Black people occurred in the United States (voter intimidation and suppression);
1903: My great grandmother was born (shows perspective on how recent this is);
1938: My grandfather was born (shows perspective on how recent this is);
1954: Brown vs. Topeka Board of Education;
1962: My mother was born (shows perspective on how recent this is);
1964: Civil Rights Act – adds voter protections;
1965: Edmund Pettus Bridge – 400 Black Americans beat and jailed for protesting voter suppression.
There’s a lot more to list but you get the point…
In the Black community, there is a lot of back and forth on the significance of voting in American society. There are Black folks who believe that their vote doesn’t matter. There are groups of people who are actively trying to suppress your Black vote. All of the energy that is put into the discussion around the importance of voting seems like a way to keep the Black voting Populus confused around whether voting is important, whether voting should be prioritized, and whether voting is a right or a privilege.
I’d like to take this opportunity to clear things up. You have a moral obligation to vote. If you don’t vote, you are ignoring the struggle of those who have protested, marched, struggled, and died so that you can vote. Don’t let propaganda and conspiracy theory distract you from your greatest power (other than praying) as an American. Your individual vote might seem like it doesn’t matter. It’s not about you individually. It is about the collective voice, the collective power that an organized voting population wields.
I read an interesting Bible Verse the other day, it’s from Philippians 2:3, which reads, “Do nothing from selfish ambition or conceit but in humility count others more significant than yourselves.”
My interpretation of this verse is sometimes you have to act in a manner outside your own desires for immediate gratification. Sometimes you even have to put aside your own opinion and ego for the greater good. That’s the voter’s spirit. Put aside your belief that the system is rigged, that your vote doesn’t matter, that the electoral college decides the vote anyway, that they’re still going to do what they want, or any other thought you have on why not to vote. Try voting because there is someone in your community that needs healthcare. Try voting because there is someone in your community that needs a basic livable minimum wage. Try voting because there is a child in your community that isn’t receiving the education that they deserve. Vote for them.
And if you’re still not convinced, then vote, because it will make you more money. Don’t believe me? I can prove it, mathematically. I’ve pulled data from the United States Census Bureau that contains both Black voter turnout and Black per capita income from the years 1964 until 2018.
Figure 1 shows Black voter turnout vs. Black per capita income:
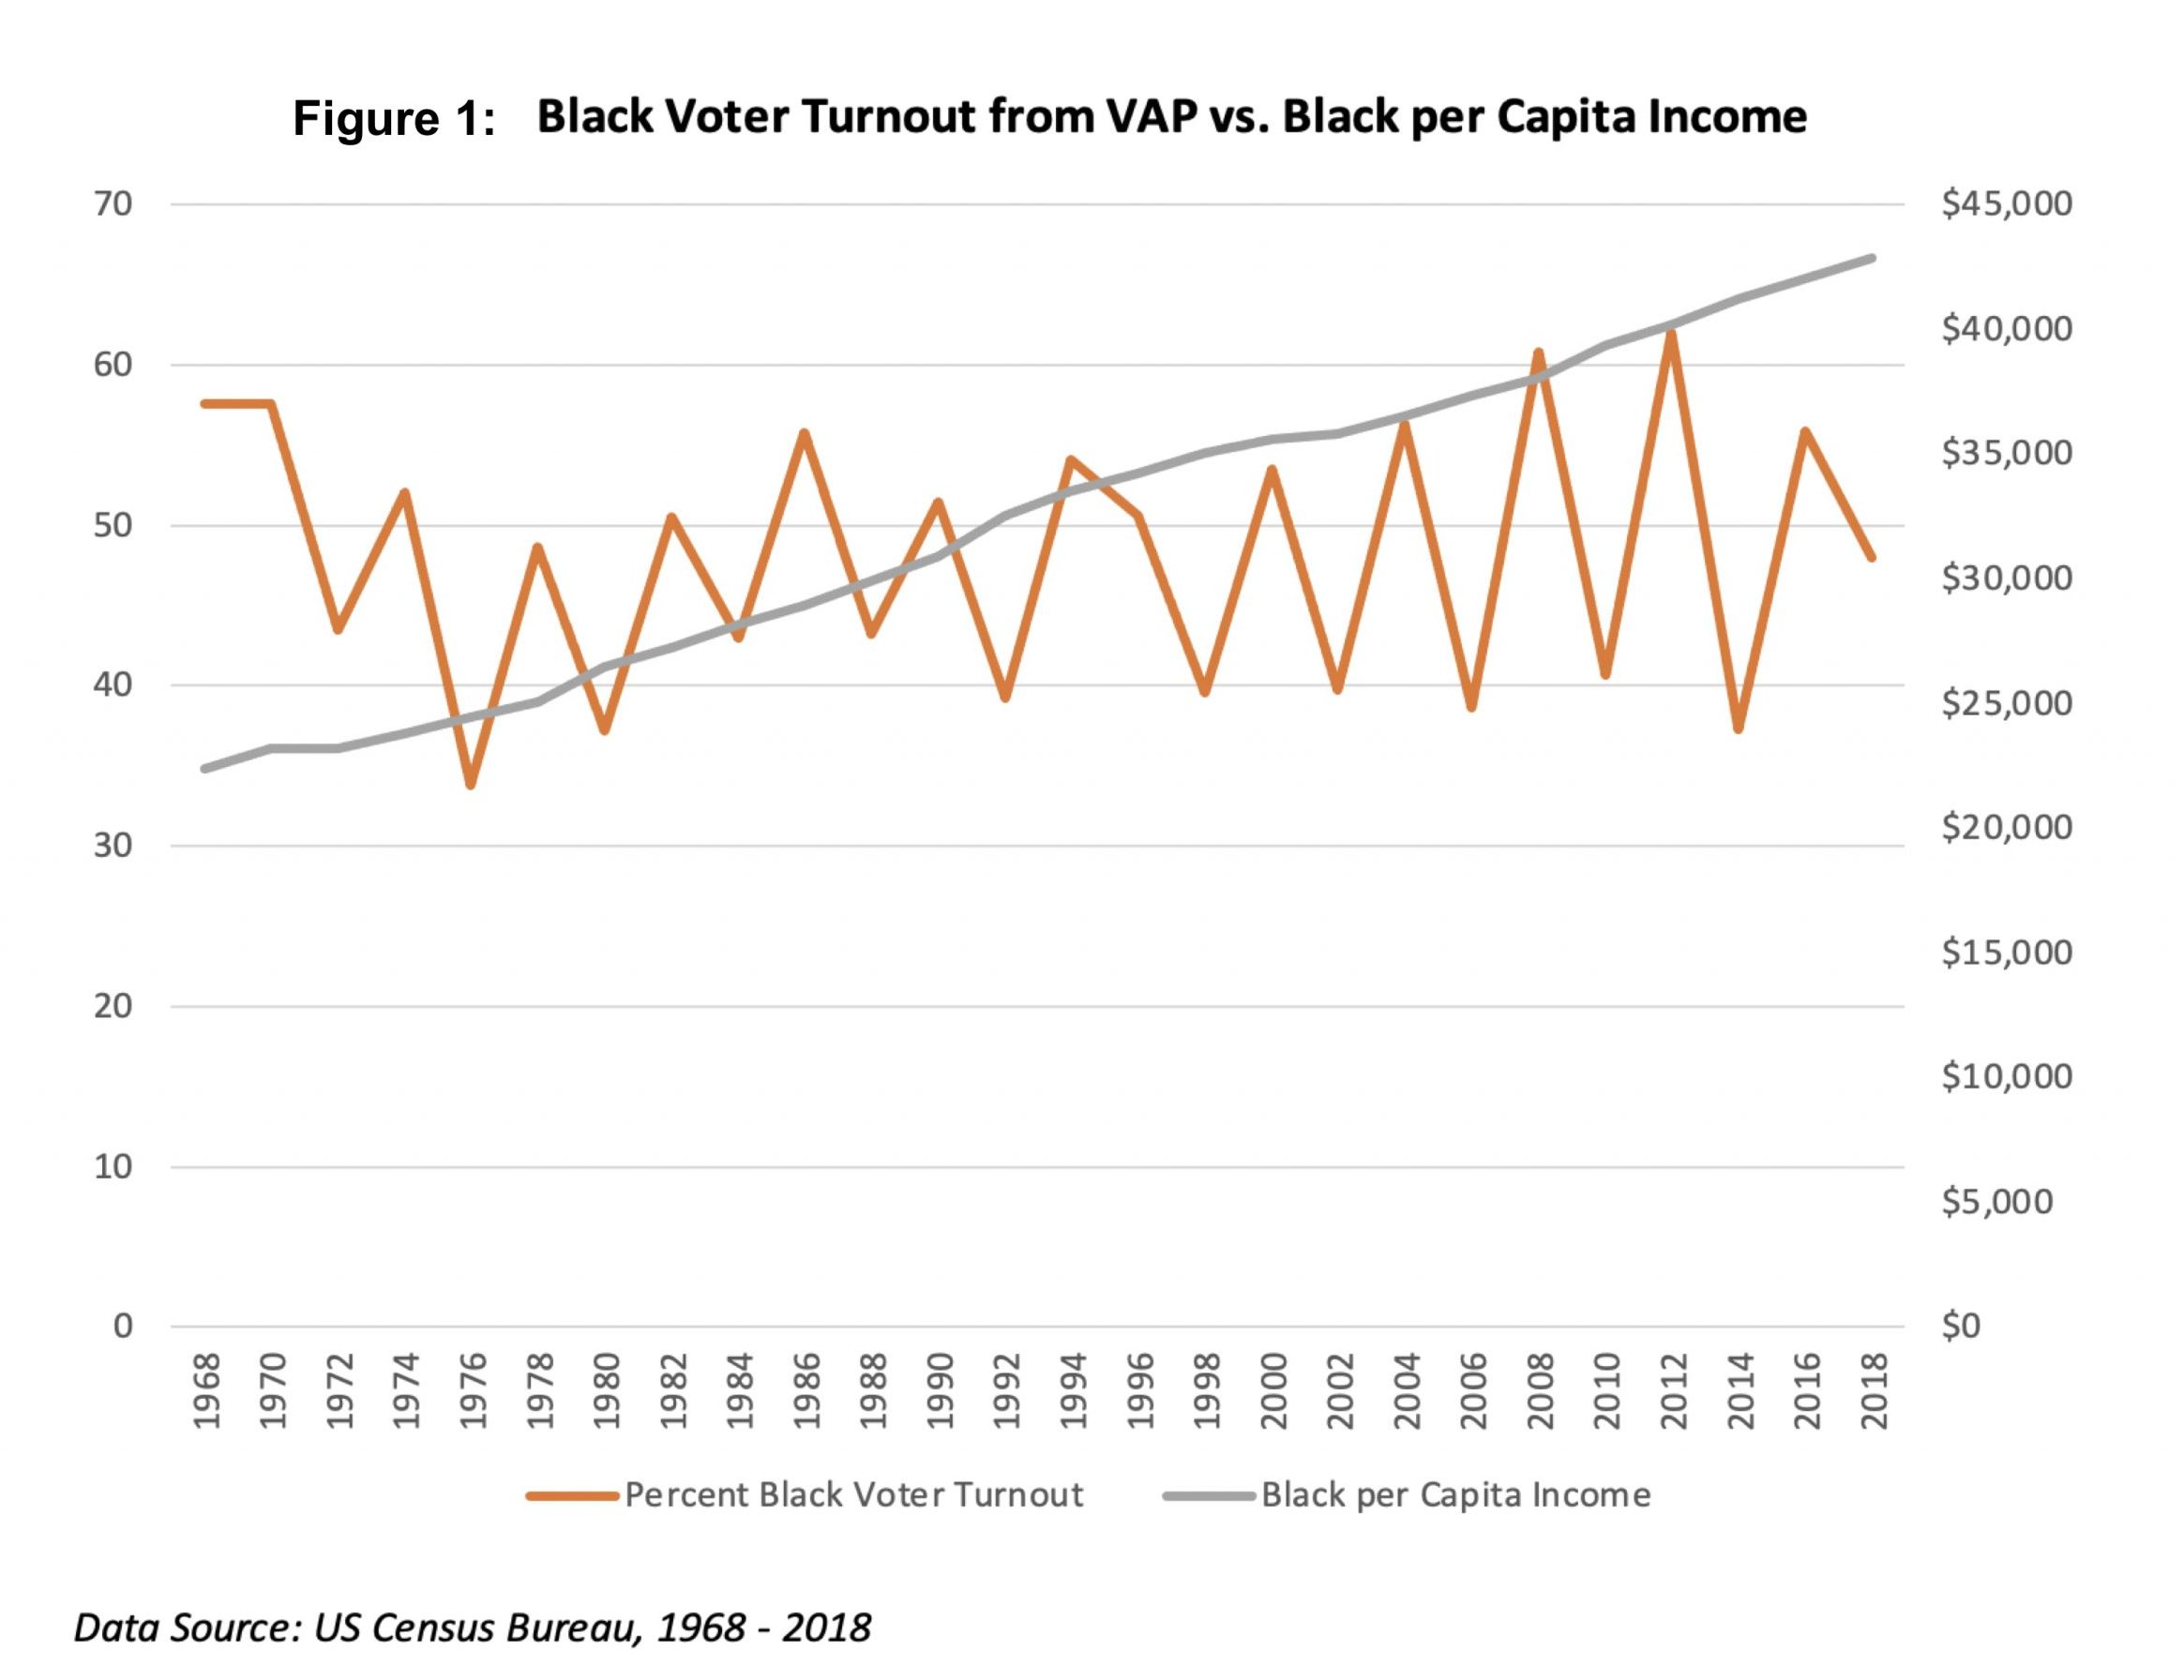
This graph shows a pretty clear indication of the linear relationship between voter turnout and per capita income. However, I’ve taken this analysis a step further and ran a descriptive, regression, and correlation analysis.
Descriptive and Exploratory Data Analysis
Table 1 reflects descriptive statistics for the voting-age population (VAP) from the years 1968 – 2018. The VAP represents those who are eligible to vote. The VAP for Black Americans has grown from 11 million in 1968 to over 32 million in 2018.
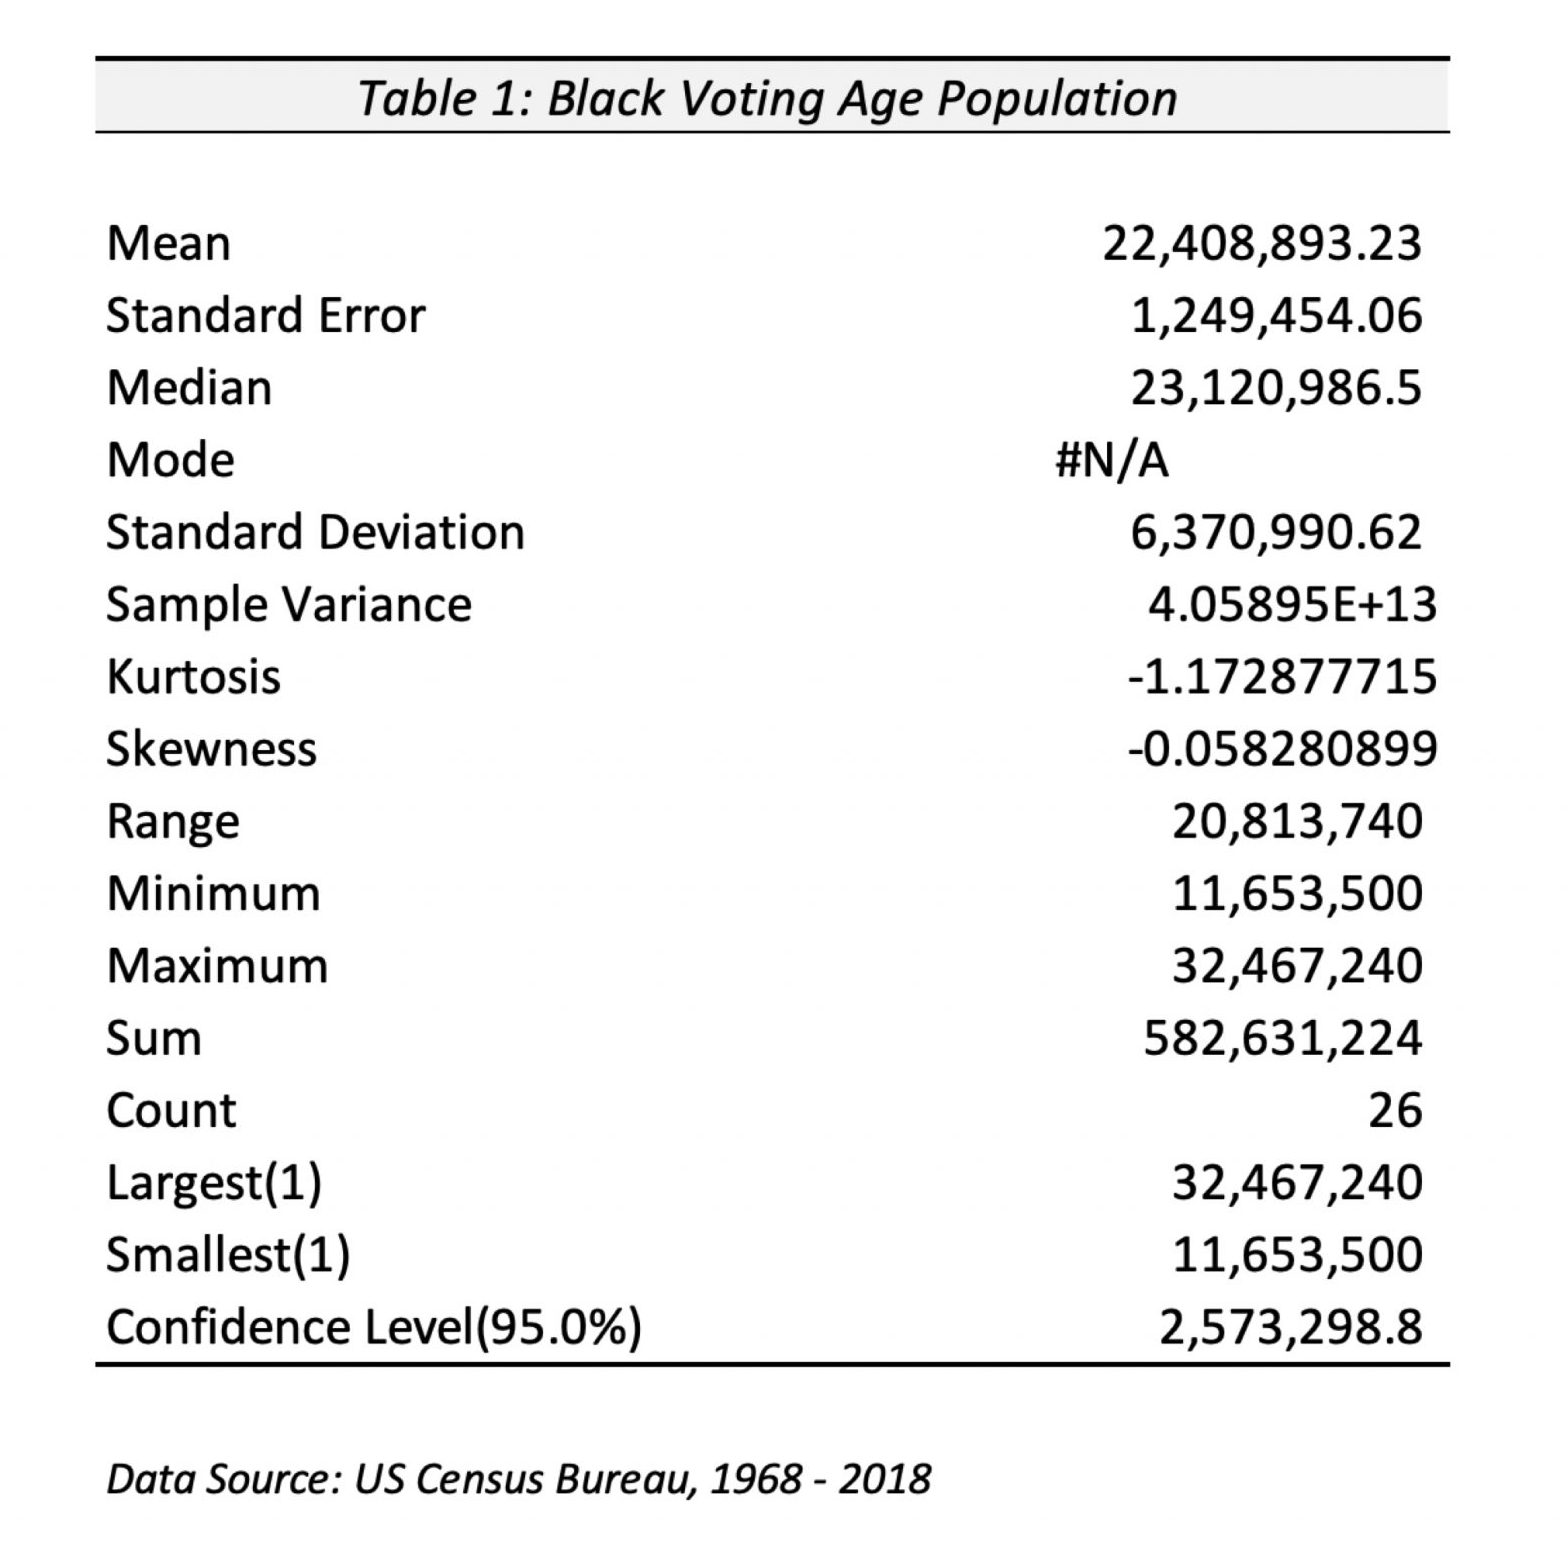
Table 2 reflects descriptive statistics for Black voter turnout from years 1968 – 2018. Black voter turnout represents the percentage of the Black VAP who cast their vote during each election year. The Black voter turnout has varied each year from 1968 – 2018 and has a mean of 47%. That means on average around 47% of the Black VAP cast their vote. The lowest turnout was in 1980 where Ronald Reagan (Republican) beat Jimmy Carter (Democrat). The highest turnout was in 2012 when Barack Obama (Democrat) beat Mitt Romney (Republican). There is also an interesting anomaly in the data where there is an average of 21% less Black voter participation in midterm versus presidential elections.
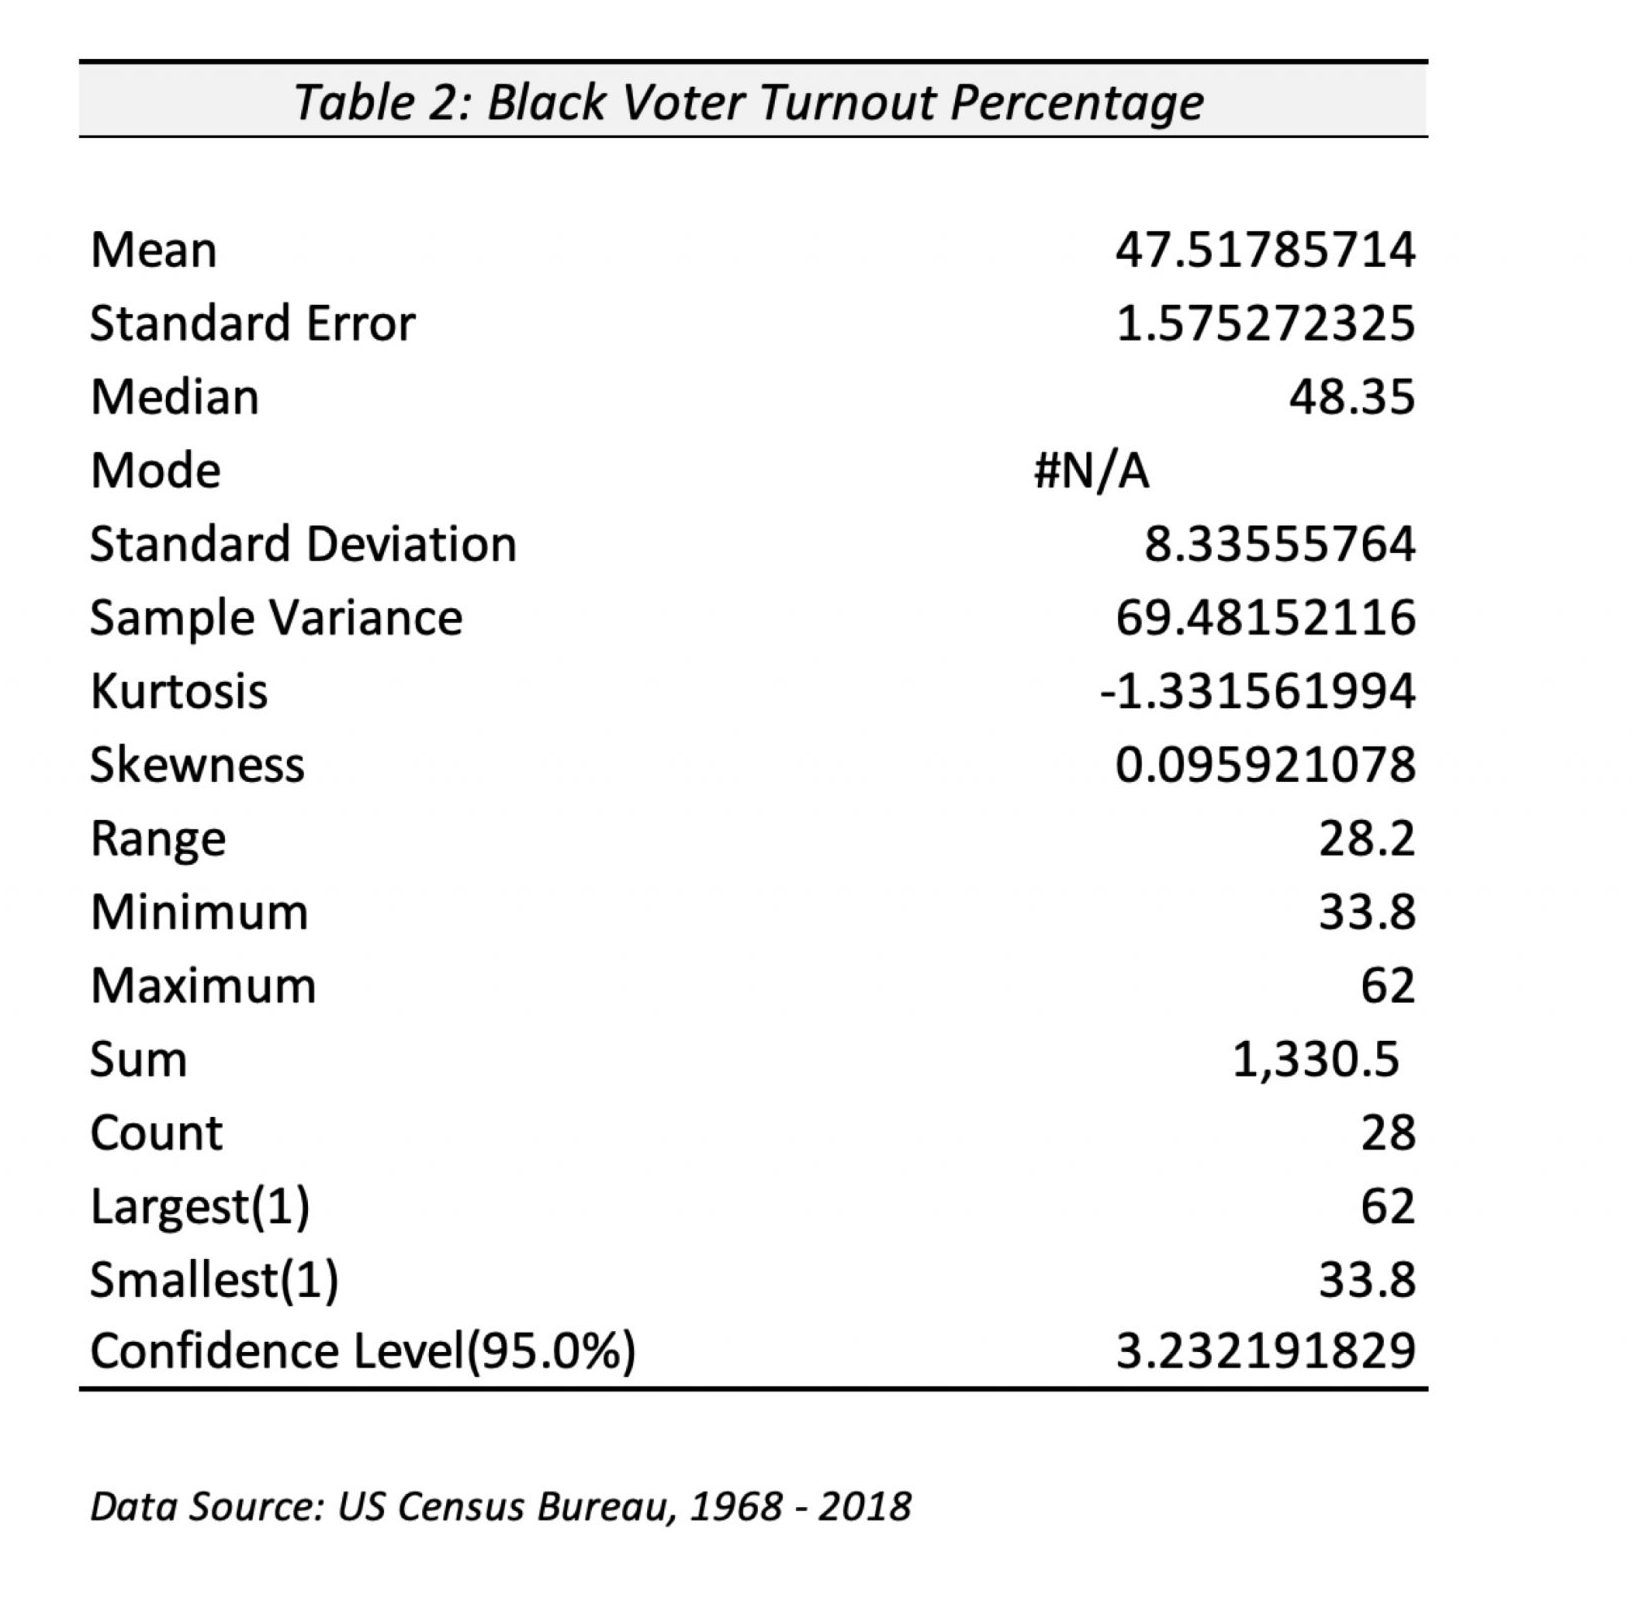

Table 3 reflects descriptive statistics for the per capita income of Black people in America from 1968-2018. The per capita income grew each year by approximately 2.6% during this time period with mean earnings just over $32,000 and maximum earnings just over $42,000. However, wage growth has slowed since 1994 with growth below 2% (1968-1994 are weighting the wage growth average of 2.6% up).
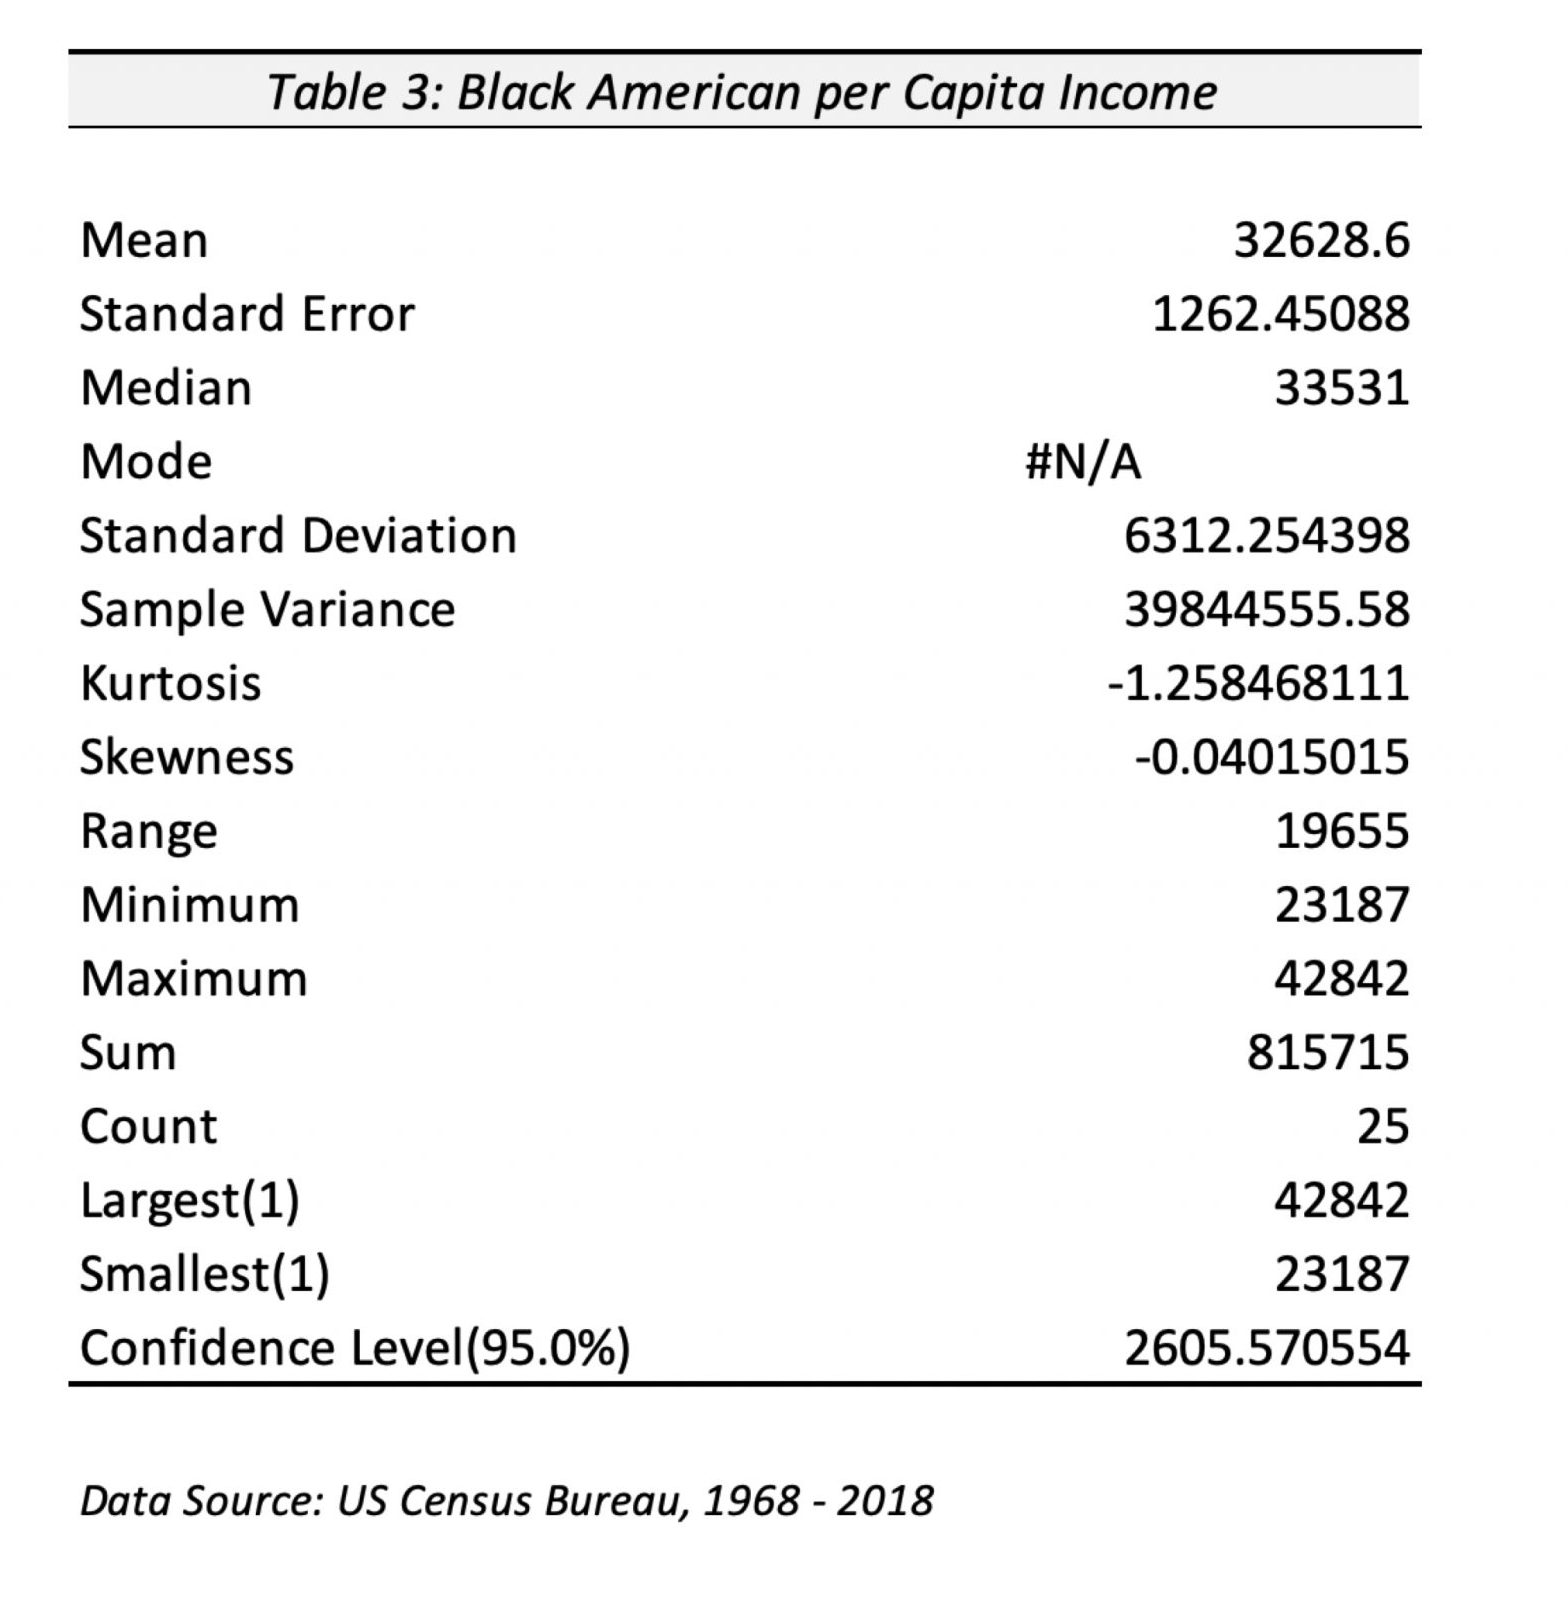

Table 4 reflects regression data that reflects the voter participation and per capita income of Black Americans for midterm and presidential election years from 1968-2018. The total number of midterm and presidential election observations during this time period equaled 26.
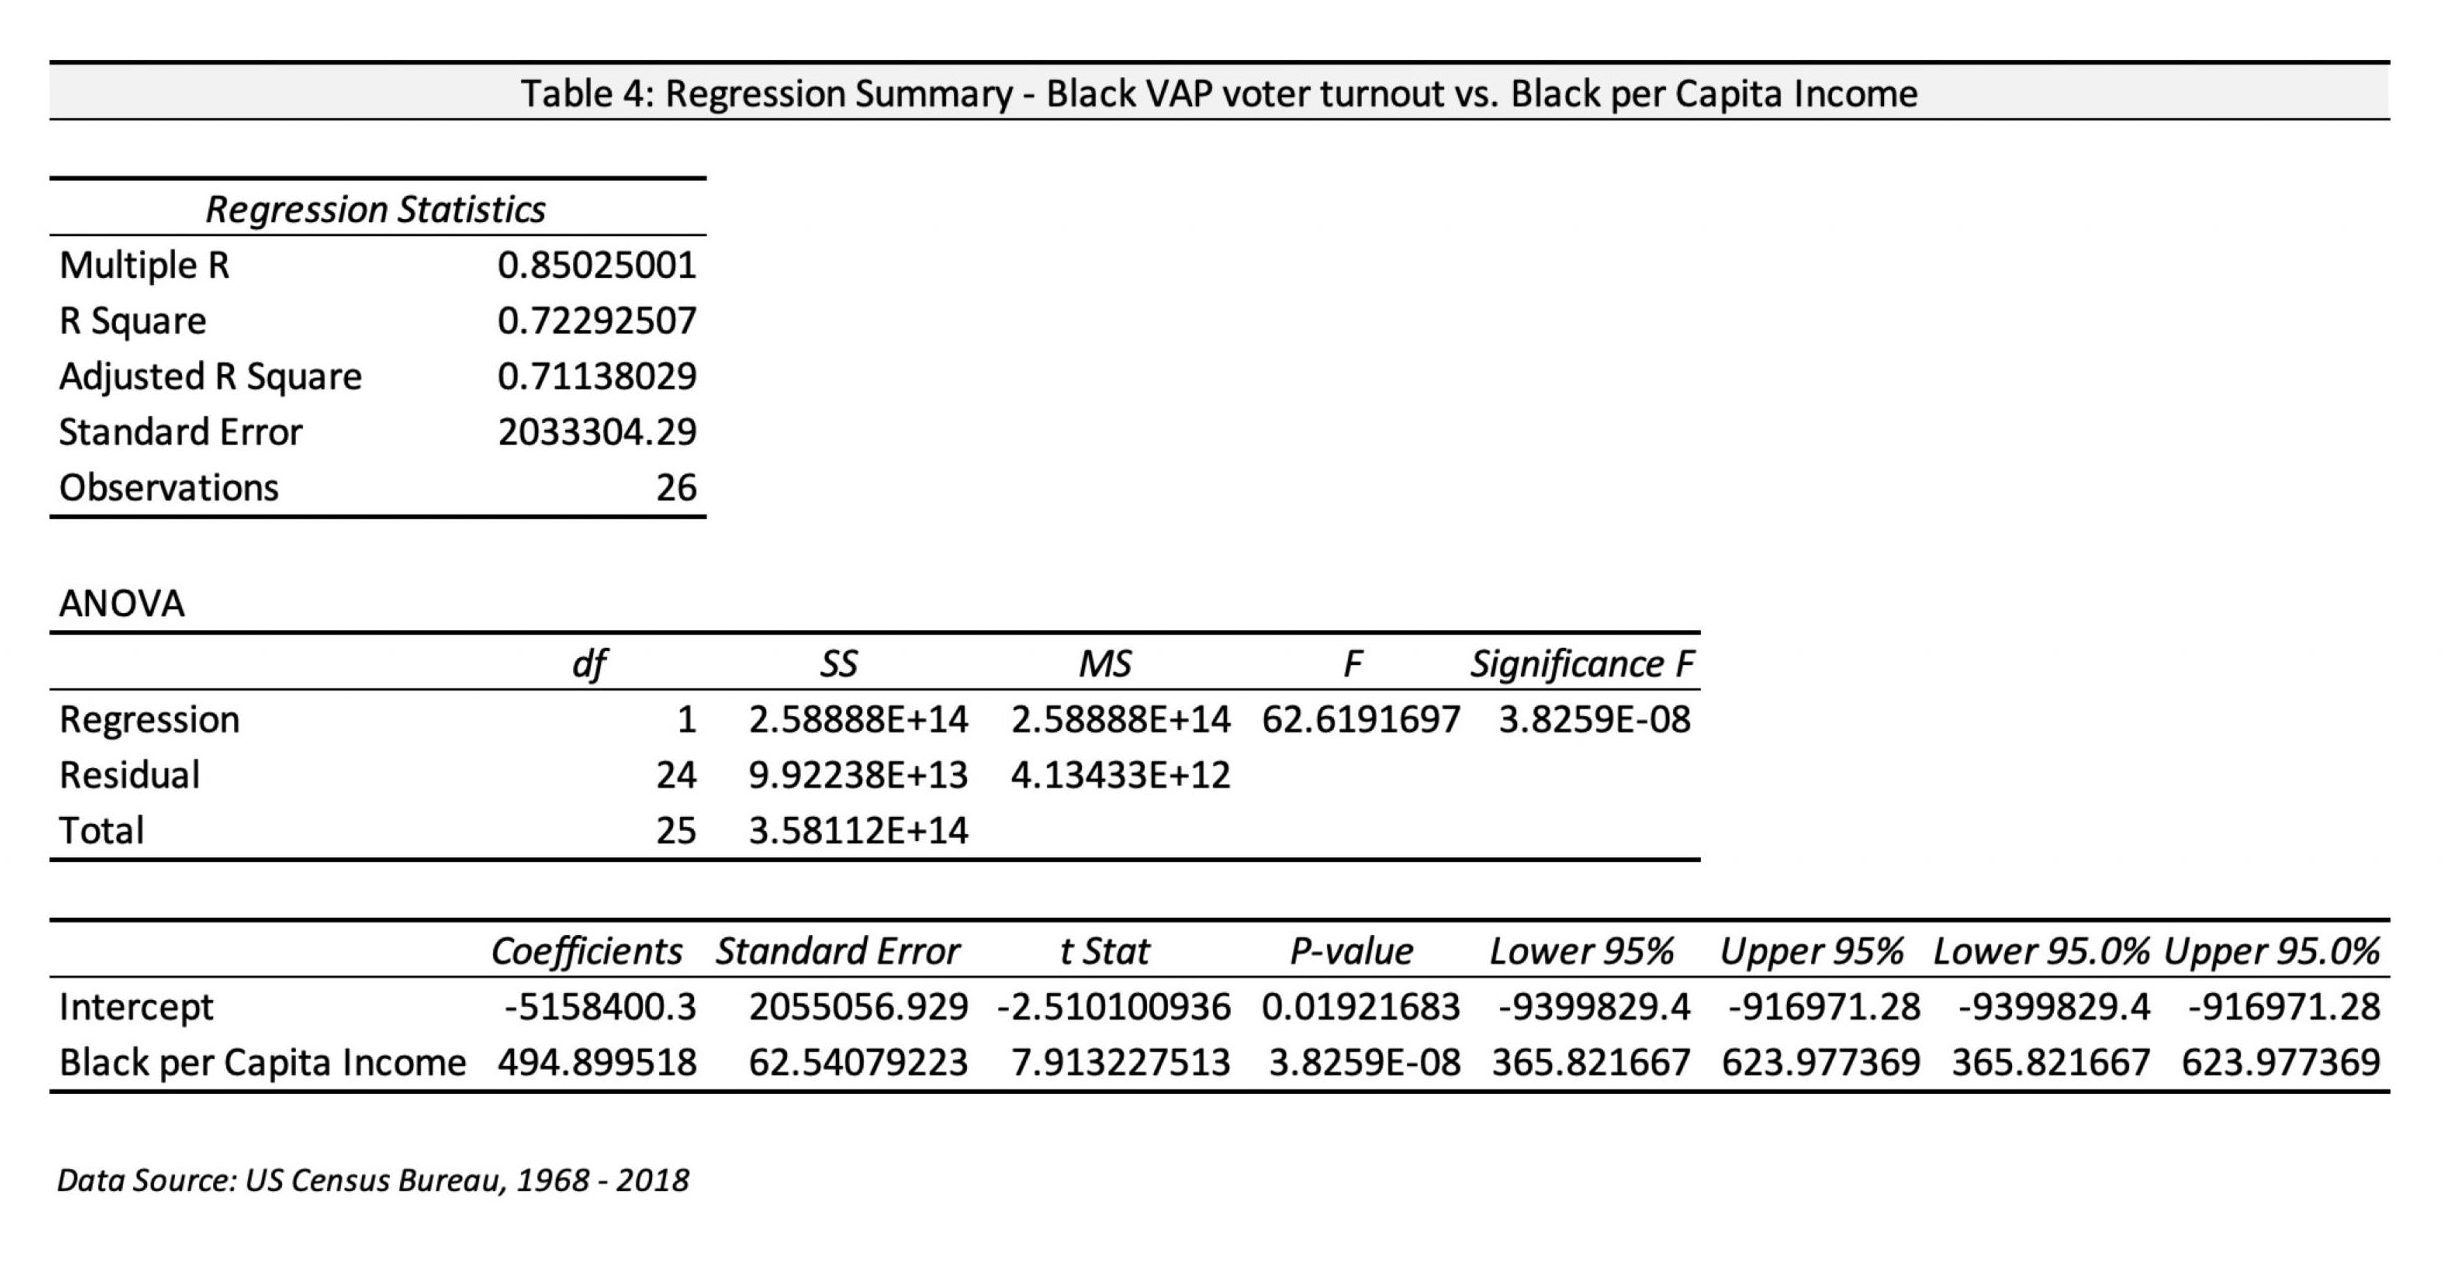
A correlation analysis was conducted to examine the relationships between Black Voter turnout within VAP and Black American per capita income over the time period 1968-2018.
The correlation analysis was conducted on the rs values at the .05 alpha levels. A strong positive relationship was found between “Black Voter turnout within VAP and Black per capita income” showing significance at the .01 level, rs (26) = .8501, p =0.0192.
What does all this mean? There is a significant direct correlation between how many Black people vote in American elections and how much money Black people earn in America. Vote like your paycheck depends on it because it likely does.
Summary of Statistics
The results of this quantitative analyses, descriptive statistics, and correlational analyses were conducted for the Black voting age population (VAP) turnout and Black per Capita Income from years 1968 – 2018, revealing significant relationships between the number of Black people who vote and the resulting Black per Capita Income in America. When reviewing the correlational analysis a strong positive correlation of .8501 was discovered. Furthermore, the p-value of 0.019216829 indicates that the NULL Hypothesis – “The number of Black people who vote do not relate to the per capita income of Black people” – should be rejected.